Lightpoint Research · Vol I
See what's really driving your portfolio.
Most apps show returns. Moonlight shows why. Upload a brokerage screenshot, and you get a report that breaks down which holdings are working, which are quietly adding risk, and how your portfolio actually behaves. Built for retail and professional individual investors who want more than a number.
How it works
From a screenshot to a real research report — in plain English.
Six things the report tells you about your portfolio. Click any line to dig into how it's calculated.
00
Upload a screenshot. Get a real report.
No accounts, no logins, no recommendations. The same deterministic analysis runs for every user.
How the pipeline works01
Like a credit score — but for your portfolio.
Four scorecards: how aggressive you are, how concentrated, how high-quality, how closely you track the market.
How each score is calculated02
What's actually moving your returns.
We split last year's returns into the same six forces academics use — so you can see if it was the market, or you, or just luck.
The six-factor model03
Are you really diversified — or just nine tech stocks?
A 3×3 grid shows where your money actually sits across size and style, plus a sector view.
Style box and sector breakdown04
Where the risk really lives.
Which holdings are quietly carrying most of your downside, and how bad a normal-bad day actually looks.
Risk decomposition05
What moved your stocks today.
The last 24 hours of news on every ticker you hold, with timestamps and source links. No summarization, no spin.
News deskReal Report · Real Data
This is the actual report — not marketing copy.
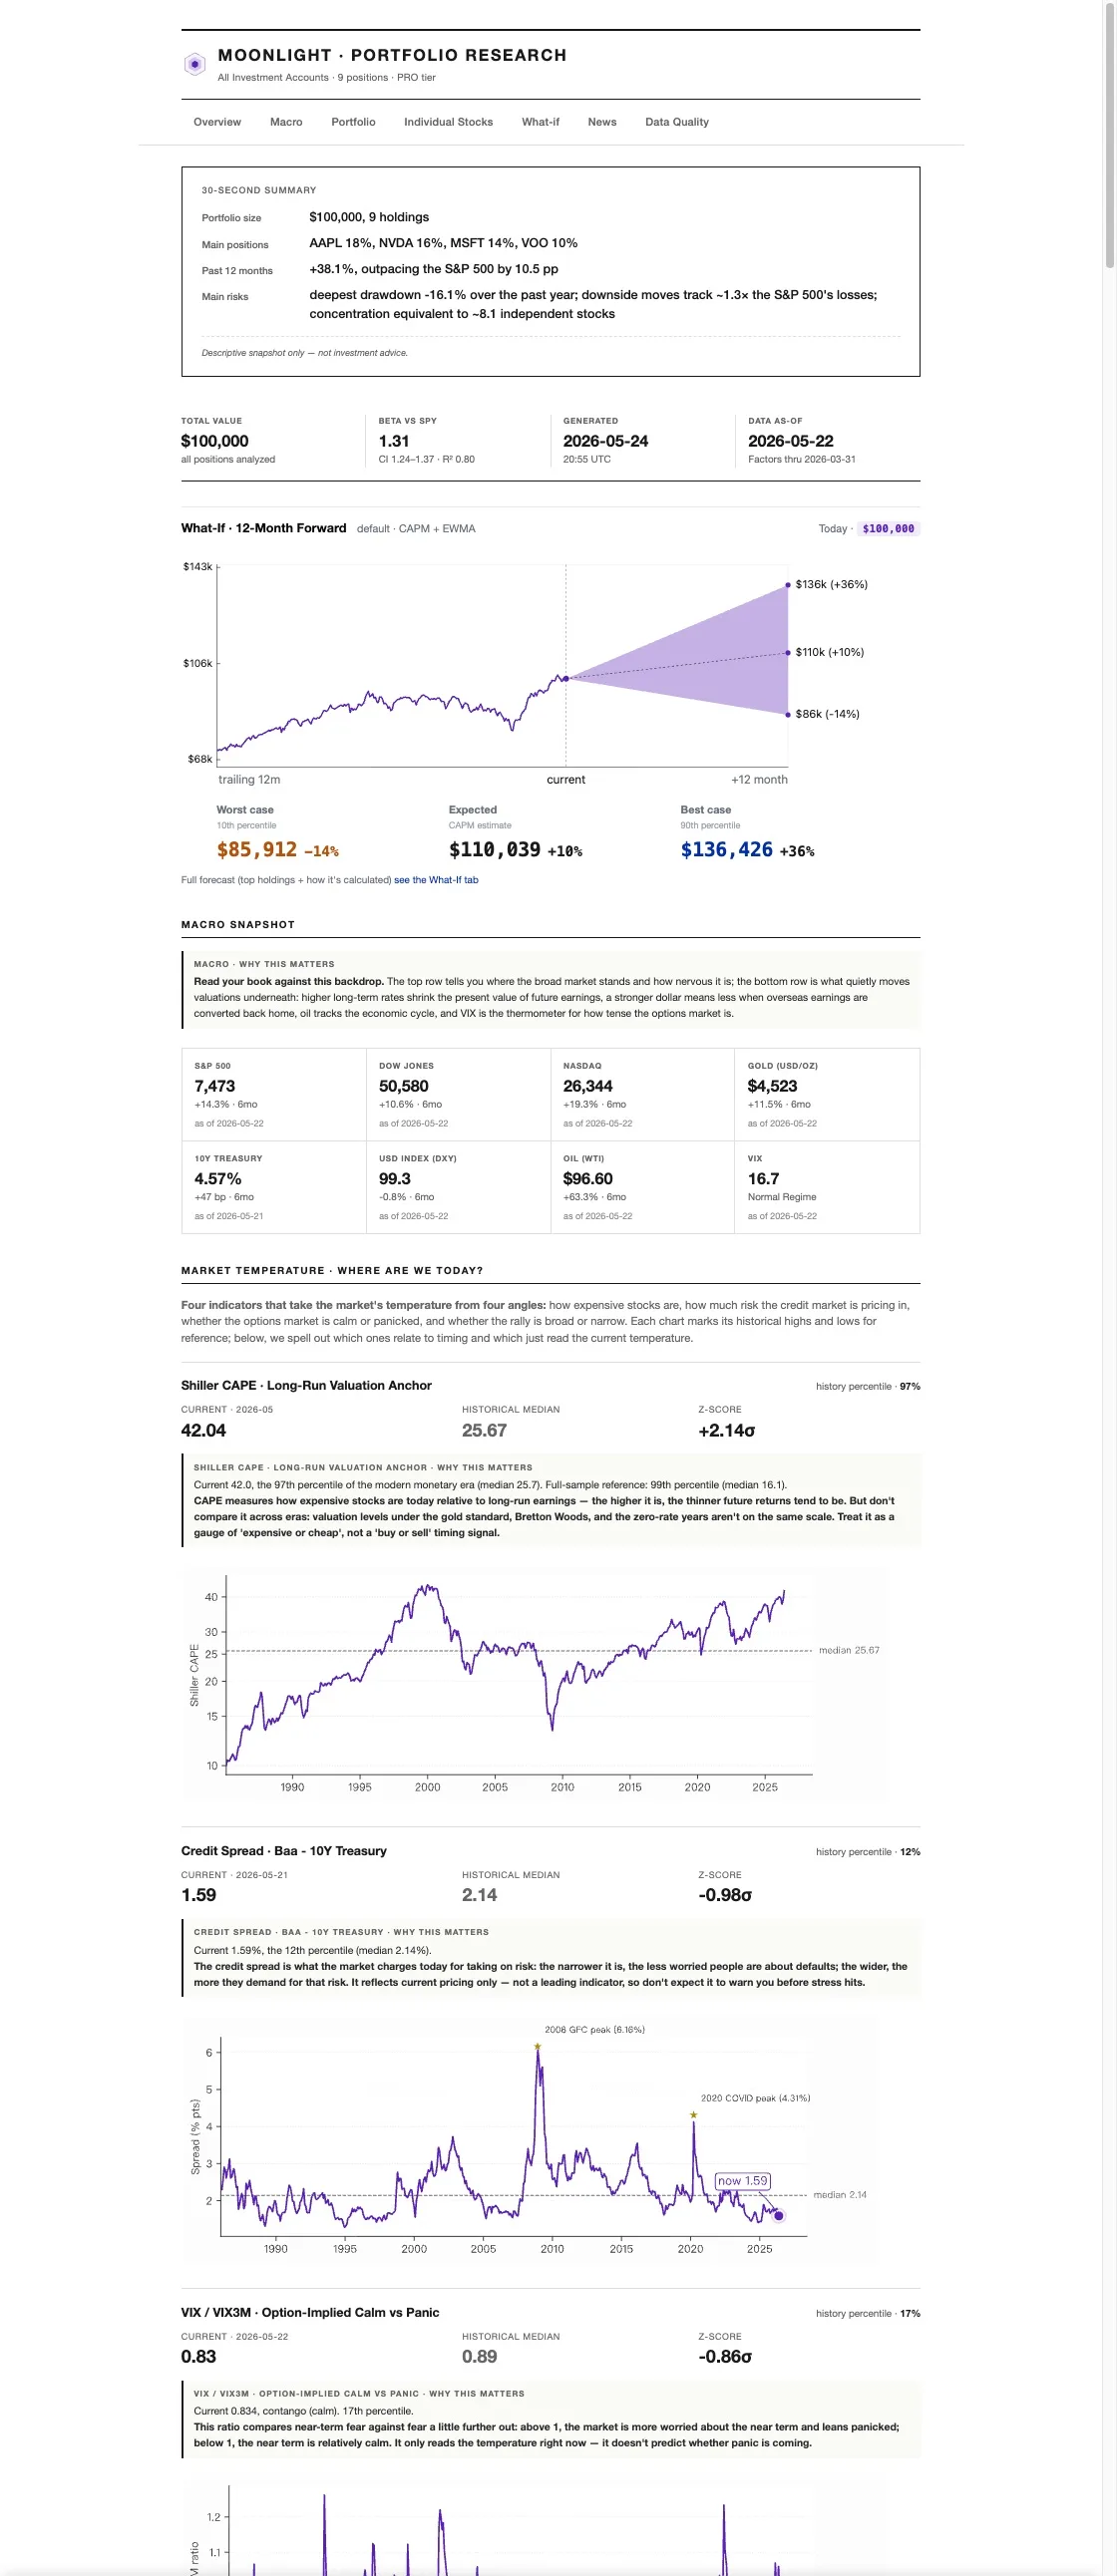
Read the full report